mRNA vaccines engage unconventional pathways in CD8+ T cell priming - Nature
All mice were housed in our specific-pathogen-free facility under 12 h-12 h light-dark cycles, maintained at 70 °F and 50% humidity, in compliance with institutional and AAALAC-accredited Animal Studies Committee guidelines at Washington University in St Louis, following all relevant ethical regulations.
For CD11c-DTR BM chimeras, CD45.1 SJL recipient mice were lethally irradiated (1,050 rads X-ray). Within 12-18 h after irradiation, the recipient mice were i.v. injected with ≥5 × 10 BM cells obtained from CD11c-DTR donor mice.
For WT- or MHC-I TKO-to-SJL BM chimeras, SJL recipient mice were depleted of NK cells by i.p. injection of 100 μg anti-NK1.1 antibody (PK136, Leinco Technologies, N123). The next day, the recipient mice were lethally irradiated (1,050 rads X-ray). Within 12-18 h after irradiation, the recipient mice were i.v. injected with ≥5 × 10 BM cells obtained from either WT or MHC-I TKO donor mice. For WT or Δ32-to-SJL or MHC-I TKO BM chimeras, SJL or MHC-I TKO recipient mice were lethally irradiated (1,050 rads X-ray). Within 12-18 h after irradiation, the recipient mice were i.v. injected with ≥5 × 10 BM cells obtained from either WT or Δ32 donor mice.
For B6 and BALB/c allogeneic BM chimera, recipient B6 and BALB/c mice were lethally irradiated with 1,050 rads and 650 rads X-ray, respectively. Donor BM from B6 or BALB/c mice was collected and treated with ACK lysis buffer to remove erythrocytes. T cells were depleted from donor BM suspensions by incubating cells with biotinylated anti-CD4 (GK1.5, BioLegend) and anti-CD8β (YTS156.7.7, BioLegend) antibodies, followed by magnetic depletion using MagniSort Streptavidin Negative Selection Beads (Thermo Fisher Scientific). After T cell depletion, ≥5 × 10 cells of prepared BM were i.v. injected into irradiated recipient mice.
All BM chimera recipients were allowed to reconstitute for at least 7 weeks before use in experiments.
Flow cytometry and cell sorting were performed using either the Aurora flow cytometer (Cytek) or FACSAria Fusion (BD) system. Data acquisition was performed using BD FACSDiva software, and analyses were conducted using FlowJo v.10.10.0 (BD Biosciences). Surface staining was performed at 4 °C in the presence of Fc block (2.4G2) in magnetic-activated cell-sorting (MACS) buffer (PBS supplemented with 0.5% BSA and 2 mM EDTA).
For depletion-based sort purification of OT-I T cells and splenic DCs, the following biotinylated anti-mouse antibodies were used: B220 (RA3-6B2), Ly6G (1A8), CD3ε (145-2C11), CD19 (6D5), TER119 (TER-119), CD8β (YTS156.7.7) and CD4 (GK1.5) (all from BioLegend), and CD105 (MJ7/18) (from Invitrogen). Biotinylated cells were detected with BV650-conjugated Streptavidin (BioLegend, 405231) and PE-Cy7-conjugated Streptavidin (BioLegend, 405206).
For biotin- and fluorochrome-conjugated antibodies, the following anti-mouse antibodies were used. From BioLegend: AF488-conjugated B220 (RA36B2, 103225), AF647-conjugated SIGLECH (551, 129608), BV510-conjugated I-A/E (M5/114.15.2, 100752), FITC-conjugated KLRG1 (2F1/KLRG1, 138409), PE- and BV421-conjugated XCR1 (ZET, 148204 and 148216), PE-Cy7-conjugated CD24 (M1/69, 138508), APC-Cy7-conjugated SIRPα (P84, 110716), BV605- and BV510-conjugated CD8α (53-6.7, 100751 and 100752), APC-Cy7-conjugated CD45.1 (A20, 110716), PE-Cy7-conjugated CD45.2 (104, 109814), BV421-conjugated H-2Kb (AF6-88.5, 116525), PE-conjugated H-2Db (KH95, 111508), PE-conjugated Vα2 (B20.1, 127808), APC-conjugated CD44 (IM7, 103028 and), PerCP-Cy5.5-conjugated CD62L (MEL14, 104432), biotin-conjugated CD69 (FN50, 310924), FITC-conjugated CD3ε (145-2C11, 100306), FITC-conjugated CD11b (M1/70, 101206), BV711-conjugated CD4 (GK1.5, 100447), AF700-conjugated F4/80 (BM8, 123130), BV421-conjugated Ly6C (HK1.4, 128032), BV711-conjugated CD115/CSF-1R (AFS98, 135515) and APC-conjugated CD226 (10E5, 128810). From BD Biosciences: BUV395-conjugated CD45R/B220 (RA3-6B2), BUV395-conjugated KIT (2B8), BV421-conjugated CD127 (Sb/199) and PE-CF594-conjugated Flt3 (A2F10.1). From Invitrogen: APC-eF780-conjugated CD44 (IM7), APC-eF780-conjugated CD11c (N418) and PerCP-ef710-conjugated Sirpα (P84).
For in vivo IFNAR1 blockade, 2 mg of anti-mouse IFNAR-1 antibody (MAR1-5A3, Leinco Technologies, I-401) was administered by i.p. injection every 7 days, beginning 1 day before immunization (day -1 and day 6).
LNs were collected and enzymatically digested in complete IMDM (I10F; Iscove's modified Dulbecco's medium with 2ME, NEAA, glutamine, penicillin-streptomycin and 10% FBS) supplemented with 30 U ml of DNase I (Sigma-Aldrich) and 250 μg ml of collagenase B (Roche) for 30-45 min at 37 °C. After digestion, single-cell suspensions were filtered through 70-μm strainers, APCs were sorted as B220MHC-IICD11cXCR1CD172α (cDC1), B220MHC-IICD11cXCR1CD172α (cDC2) and B220MHC-II (B cells) cells.
For cDC staining, spleen and LNs were collected and enzymatically digested in I10F supplemented with 30 U ml of DNase I (Sigma-Aldrich) and 250 μg ml of collagenase B (Roche) for 30-45 min at 37 °C. After digestion, single-cell suspensions were filtered through a 70-μm strainer and stained for flow cytometry analysis.
For CD8 T cell staining, spleen, LNs and peripheral blood were collected, mechanically dissociated and passed through a 70-μm strainer for single-cell suspensions. After ACK lysis, cells were stained for flow cytometry.
BM was collected from the femurs, tibias and pelvis by mechanical disruption using a mortar and pestle in MACS buffer. Cell suspensions were passed through a 70-µm strainer, erythrocytes were lysed with ACK buffer and the resulting cells were stained for flow cytometry.
Mice were perfused with cold PBS containing 2 mM EDTA before tissue collection. Tibialis anterior and gastrocnemius-soleus muscles were dissected, trimmed of fat and nerves, and processed for immune-cell isolation using a Percoll gradient. Muscles were minced in IMDM and digested in collagenase D 1.0 mg ml, DNase I 30 U ml in IMDM at 37 °C for 45 min with shaking. Digestion was stopped with I10F, and suspensions were filtered through a 70-µm mesh and pelleted. Cell pellets were resuspended in 40% Percoll-RPMI and overlaid onto 80% Percoll-PBS, then centrifuged at 1,400g for 15 min without brake. Leukocytes at the 40%/80% interface were collected, washed with I10F and stained for flow cytometry.
Cap 1 N1meΨ OVA mRNA was provided by Innovac Therapeutics or purchased from PackGene. OVA mRNA or dead (non-coding) mRNA LNPs were formulated in lipids at molar ratios of 50:38.5:10:1.5 (ionizable lipid SM-102:cholesterol:DSPC:DMG-PEG2000). LNP size and size distribution, encapsulation efficiency, stability and endotoxin level were rigorously tested. mLama4 mRNA was provided by R.D.S. For in vivo studies, 50 µl mRNA-LNP containing 10 µg mRNA was injected i.m. into the gastrocnemius muscle. Unless indicated otherwise, mRNA-LNP was administered on day 0 and day 7, and the immune responses were measured at day 11.
Plasmid DNA encoding the full-length OVA was amplified in Escherichia coli DH5α (Invitrogen) and purified using the NucleoBond Maxi Plasmid DNA Purification kit (Macherey-Nagel). Empty pcDNA3.1(+) vector DNA was used as control. DNA vaccination was performed using a Helios gene gun (Bio-Rad). Mice were vaccinated with 4 µg of DNA at 3-day intervals (day 0, 3 and 6) for a total of three doses. DNA was delivered to non-overlapping shaved and depilated abdominal areas, with helium discharge pressure set to 400 p.s.i. Immune responses were measured 5 days after the last gene gun vaccination (day 11).
Soluble ovalbumin (low endotoxin; Worthington, LS003509) was dissolved in PBS and emulsified 1:1 (v/v) with AddaVax (InvivoGen; vac-adx-10) at 4 °C by vortexing for 2 min. Mice were immunized i.m. with 50 μl of emulsion containing 10 µg OVA on days 0 and 7, into the same flank.
Freeze-thawed Abelson-mOVA cells were used to standardize antigen quantity without cell proliferation, as previously described. In brief, Abelson-mOVA cells were generated by retroviral transduction of Abl-MuLV-transformed MHC-I TKO BM tumour cell line with a membrane-OVA construct (Abl-MuLV was a gift from B. Sleckman). Cells underwent three rapid freeze-thaw cycles and were stored at -20 °C until use. Mice were immunized with 3.3 × 10 freeze-thawed Abelson-mOVA cells.
LNs and spleens from CD45.1 OT-I mice were collected, mechanically dissociated into and passed through 70-μm strainers to generate a single-cell suspension. Erythrocytes were lysed with ammonium-chloride-potassium bicarbonate (ACK) lysis buffer. Cells were depleted of TER-119-, I-A/E-, Ly-6G- and B220-expressing cells by incubation with biotinylated antibodies for 20 min at 4 °C, followed by depletion with MagniSort Streptavidin Negative Selection Beads (Thermo Fisher Scientific). Naive OT-I cells were sorted as B220CD45.1CD4CD8Vα2CD44CD62L, washed with PBS and labelled with CTV proliferation dyes (Thermo Fisher Scientific).
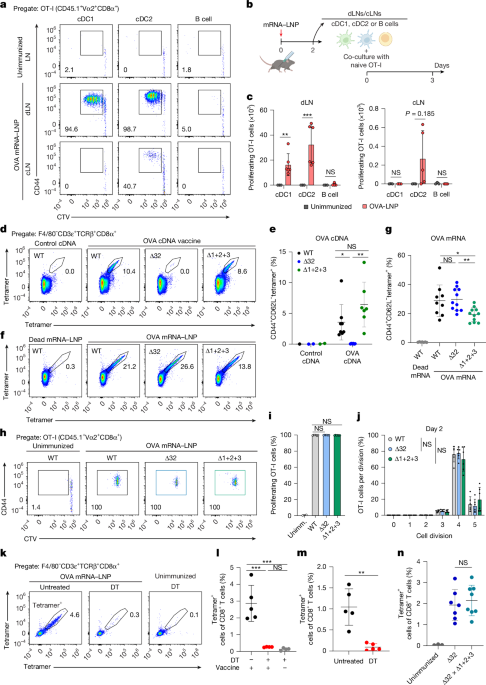
For ex vivo cross-presentation assays, 2.5 × 10 CTV-labelled OT-I cells were co-cultured with sorted cDC1, cDC2 or B cells isolated from dLNs or cLNs 2 days after immunization. Co-cultures were performed in a well of U-bottom 96-well plates. After 3 days, cells were washed, surface-stained with antibodies and analysed for CTV dilution and CD44 expression.
For in vivo antigen-presentation assays, 5 × 10 CTV-labelled naive OT-I cells were i.v. transferred into recipient mice. Then, 1 day later, the mice were immunized with the indicated antigens. At the indicated timepoints, spleens were collected and erythrocyte lysed with ACK buffer, and CD45.1 OT-I cells were analysed for CTV dilution and CD44 expression.
In OT-I proliferation assays, the average division number was calculated as ∑(fraction of total OT-I cells in division n × n) based on the peak of the undivided control without immunization and the peak for each division automatically fit by FlowJo software. The gate boundaries were adjusted to the lowest population between two peaks.
For T cell egress blockade, 1 mg per kg body weight of FTY720 (Sigma-Aldrich, SML0700) was administered by i.p. injection in 150 μl PBS 1 day after OT-I cell adaptive transfer.
For blockade of naive T cell entry to lymphoid organs, splenectomy was performed by WashU Medicine Animal Surgery Core under anaesthesia using standard surgical removal of the spleen, followed by closure of peritoneum and skin. Mice were monitored daily for 4 days to ensure recovery. On day 5 after surgery, mice were injected i.p. with 200 μg anti-CD62L (MEL-14; Leinco Technologies, C2118). Then, 6 h later, the mice were adoptively transferred i.v. with CTV-labelled naive OT-I cells. The next day, mice were immunized with 0.1 μg OVA mRNA-LNP.
Spleens were collected and passed through 70-μm strainers to generate single-cell suspensions. After erythrocyte lysis with ACK lysis buffer, cells were resuspended in MACS buffer. After counting with a ViCell analyser, 3 × 10 splenocytes were used for staining. APC- and PE-conjugated H-2Kb chicken ova 257-264 SIINFEKL tetramers (NIH Tetramer Core Facility) were added at a concentration of 1:100 in MACS buffer containing 10% Fc Block (2.4G2) and incubated at 37 °C for 15 min. Without washing, fluorochrome-conjugated antibodies for surface staining were then added directly and incubated at 4 °C for 30 min.
The ELISpot assay was performed using the Mouse IFNγ (ALP) ELISpot Plus Kit (Mabtech) according to the manufacturer's instructions. In brief, mouse spleen cell suspensions (1 × 10-2 × 10 cells) after ACK lysis were incubated in triplicate for 20 h with or without the presence of 1 μM SIINFEKL peptide (AnaSpec). After extensive washes, biotinylated detection antibody was added followed by streptavidin-ALP and insoluble BCIP/NBT-plus substrate. Plates were scanned and analysed on an ImmunoSpot Reader (CTL).
The contralateral inguinal LN was fixed for 6 h shaking at 4 °C in 4% paraformaldehyde (PFA) (Santacruz, sc-281692) that was adjusted to pH 9.0 with triethanolamine. LNs were washed out of PFA in 1× PBS with 10 U ml heparin, embedded in 4% low-melting-point agarose, and sectioned into 200-μm sagittal slices using the LeicaVT1200 vibratome. The sections were blocked in ADAPT-3D blocking buffer (Leinco, B673) for 1 h and then stained with primary antibodies against CD11c (Bio-Rad, MCA1369, N418) and F4/80 (BioLegend, 123101, BM8) diluted 1:200 from a stock concentration of 1 mg ml in ADAPT-3D blocking buffer and left shaking at room temperature overnight. The sections were washed in 1× PBS with 10 U ml heparin and 0.2% Tween-20, three times for 1 h each. The sections were stained with secondary antibodies overnight (Jackson ImmunoResearch, Cy3 goat anti-Armenian hamster IgG, 127-165-160; AF647 donkey anti-rat IgG, 712-605-153) diluted 1:300 from a stock concentration of 1.5 mg ml in ADAPT-3D blocking buffer after first passing through a 0.22-μm PVDF filter (Millex, SLGVR04NL) and with anti-CD169 (Bio-Rad, MCA947GA, MOMA-1) directly conjugated with CF488 (Biotium, 92253). The sections were washed in 1× PBS with 10 U ml heparin and 0.2% Tween-20 three times for 1 h each. For three sections per LN, a tilescan with 9-μm z stacks was acquired with a ×20 lens (air, 0.8 NA) on a Leica SP8 confocal microscope. Images were Gaussian or median filtered using Imaris v.10.1.1 and representative images were exported as a maximum-intensity projection.
The 1956 tumour cell line expressing membrane-bound ovalbumin (1956-mOVA) was derived from the methylcholanthrene (MCA)-induced fibrosarcoma 1956 tumour (from R.D.S.), as previously described. The original tumour was generated in a female C57BL/6 mouse, tested for mycoplasma contamination and banked at low passage. For experiments, tumour cells were thawed from frozen stocks and cultured for 4-6 days in vitro with one intervening passage in RPMI medium supplemented with 2ME, NEAA, glutamine, penicillin-streptomycin and 10% FBS (R10F).
On the day of injection, tumour cells were collected by trypsinization, washed three times with PBS and resuspended at 6.67 × 10 cells per ml. Mice were subcutaneously injected into the shaved flank with 1 × 10 cells. Tumour growth was monitored every 3-5 days using callipers. Two perpendicular diameters of tumour mass were measured and multiplied to calculate the tumour area (mm). In accordance with IACUC-approved protocol, tumours were not permitted to exceed 20 mm in maximal diameter at any point.
In vivo killing assays were performed on mice 6 weeks after the second OVA mRNA-LNP immunization. Splenocytes from naive CD45.1 SJL mice were collected, ACK lysed and prepared as a single-cell suspension. Cells were resuspended in I10F at 2 × 10 cells per ml, and divided into two equal fractions and pulsed with either 1 μg ml SIINFEKL or 1 μg ml irrelevant control peptide for 30 min at 37 °C. Cells were then washed twice with PBS and stained at 5 µM for CTV or at 0.5 µM for CTV for 10 min at 37 °C, and mixed at a ratio of 1:1 immediately before transfer.
Statistical analyses were performed using GraphPad Prism software v.10. Centre values represent the mean and the error bars indicate s.d. unless otherwise specified. For groups that are not assumed to have equal variances, Welch's or Brown-Forsythe one-way ANOVA was used.
OVA-tetramer-specific splenic cells were isolated from WT, Δ32 and Δ1+2+3 mice and washed with 1× PBS containing 0.04% BSA. Before fluorescence-activated cell sorting, cells from each individual mouse were stained with hashtag oligonucleotides (HTOs) to enable multiplexing and improve sample throughput. cDNA was prepared after the GEM generation and barcoding, followed by the GEM-RT reaction and bead clean-up steps. Purified cDNA was amplified for 11-16 cycles before being cleaned-up using SPRIselect beads. The samples were then run on a Bioanalyzer to determine the cDNA concentration. V(D)J target enrichment (TCR) was performed on the full-length cDNA. Gene expression, enriched TCR and feature libraries were prepared as recommended by the 10x Genomics 'Chromium GEM-X Single Cell 5' Reagent Kits User Guide (v3 Chemistry Dual Index) with Feature Barcoding technology for Cell Surface Protein and Immune Receptor Mapping' user guide, with appropriate modifications to the PCR cycles based on the calculated cDNA concentration. For sample preparation on the 10x Genomics platform, the Chromium GEM-X Single Cell 5' Kit v3, 16 rxns (PN-1000699), Chromium GEM-X Single Cell 5' Chip Kit (PN-1000698), Chromium Single Cell Mouse TCR Amplification Kits (PN-1000254), Dual Index Kit TT Set A, 96 rxns (PN-1000215), Chromium GEM-X Single Cell 5' Feature Barcode Kit v3, 16 rxns (PN-1000703) and Dual Index Kit TN Set A, 96 rxns (PN-1000250) were used. The concentration of each library was accurately determined by quantitative PCR using the KAPA library Quantification Kit according to the manufacturer's protocol (KAPA Biosystems/Roche) to produce cluster counts appropriate for the Illumina NovaSeq6000 instrument. Normalized libraries were sequenced on the NovaSeqX plus S4 Flow Cell using the XP workflow and a 151 × 10 × 10 × 151 sequencing recipe according to the manufacturer's protocol. A median sequencing depth of 50,000 reads per cell was targeted for each gene expression library and 5,000 reads per cell for each V(D)J and feature library. The reads for each sequencing library were then aligned and quantitated with 10x CellRanger v.9.0.1 against the 10x standard refdata-gex-mm10-2020-A mouse gene reference and refdata-cellranger-vdj-GRCm38-alts-ensembl-7.0.0 VDJ reference according to the manufacturer's protocol.
Single-cell gene expression analysis was performed in R (v.4.4.0) using the Seurat package (v.5.3.0). HTO data were first normalized individually for each sample (Supplementary Table 2) and demultiplexed using the HTODemux function; only singlet cells were retained for further analysis. Cells with >5% mitochondrial gene expression were excluded, and only those expressing between 200 and 4,000 genes were retained to remove low-quality cells and potential doublets. After quality control, data from all samples were merged and normalized. The 3,000 most-variable genes were identified, and mitochondrial, ribosomal and TCR genes were excluded from this list to avoid biases associated with highly abundant or cell-type-specific transcripts. The data were then scaled, principal component analysis was performed followed by batch correction and data integration using Harmony. Dimensionality reduction of the integrated matrix was carried out using UMAP based on the first 30 principal components. Phenotypic clusters were identified by constructing a k-nearest neighbours graph and applying the Louvain algorithm with a resolution parameter of 0.4.
For TCR repertoire analysis, cell phenotype, sample identity and mouse ID information were extracted from the integrated metadata for each cell. TCR sequences were successfully annotated for 46,051 cells and used for downstream clonotype analyses. Cells sharing identical CDR3αβ amino acid sequences were defined as belonging to the same TCR clone.
Further information on research design is available in the Nature Portfolio Reporting Summary linked to this article.